Best Marketing Reporting Software in 2026: 8 Tools Compared
Compare the best marketing reporting software in 2026 for agencies and in-house teams, with client dashboards, white-label reports, live data and pricing.
- Editor's choice
 AgencyAnalytics
Agencies billing per client
Starts atFrom $20 per client per monthVisit agencyanalytics.comFull review - Great alternative
 Databox
Goals and alerts across channels
Starts atFrom $79 per monthVisit databox.comFull review - Also consider
 Whatagraph
Large agencies and blended data
Starts atSee websiteVisit whatagraph.comFull review
TL;DR:
- AgencyAnalytics and DashThis suit agencies that need client-ready reports without heavy custom work.
- Databox works well when goals, alerts and cross-channel dashboards matter more than polished PDFs alone.
- Supermetrics fits teams that already report in Looker Studio or Sheets and want a data pipeline, not a portal.
- Whatagraph suits larger agencies with complex blending and design needs, at a higher price point.
- Check dashboard, source and client limits before signing, because those limits drive the real monthly cost.
Quick comparison
| Tool | Best for | Starts at | Free plan? | |
|---|---|---|---|---|
| AgencyAnalytics | Agencies billing per client | From $20 per client per month | No | Visit |
| Databox | Goals and alerts across channels | From $79 per month | Yes | Visit |
| Whatagraph | Large agencies and blended data | See website | No | Visit |
 Supermetrics | Feeding Looker Studio and Sheets | From $44 per month | No | Visit |
 DashThis | Fast client-ready dashboards | From $44 per month | No | Visit |
 Klipfolio | Custom metric dashboards | See website | No | Visit |
 Swydo | Low-cost agency reporting | From $49 per month | No | Visit |
 Looker Studio | Free reporting for Google-centered teams | Free | Yes | Visit |
The best marketing reporting software
We chose tools that pull live marketing data into readable reports, not tools that only store screenshots or manual tables. The list covers agency portals, goal tracking, data pipelines and a free option for smaller teams.

AgencyAnalytics is built for agencies that report to many clients each month. Each client gets a dashboard and portal that can carry the agency brand, so reports look like a service rather than a spreadsheet export. Integrations cover paid media, SEO, social and analytics, which helps full-service teams avoid separate tools for each channel. The per-client pricing model is easy to understand, though it adds up as the roster grows. Teams should model cost at 10, 25 and 50 clients before committing. Rank tracking and AI tracking are add-ons on some plans, so check those costs if SEO reporting is central. For agencies that want a predictable, client-ready workflow, AgencyAnalytics is a strong default. It is less appealing for a single brand that only needs a few internal dashboards. The trial period is worth using with real client data.
- White-label portals included, broad integration library, SEO and paid reporting together
- Cost grows linearly with clients, some add-ons cost extra
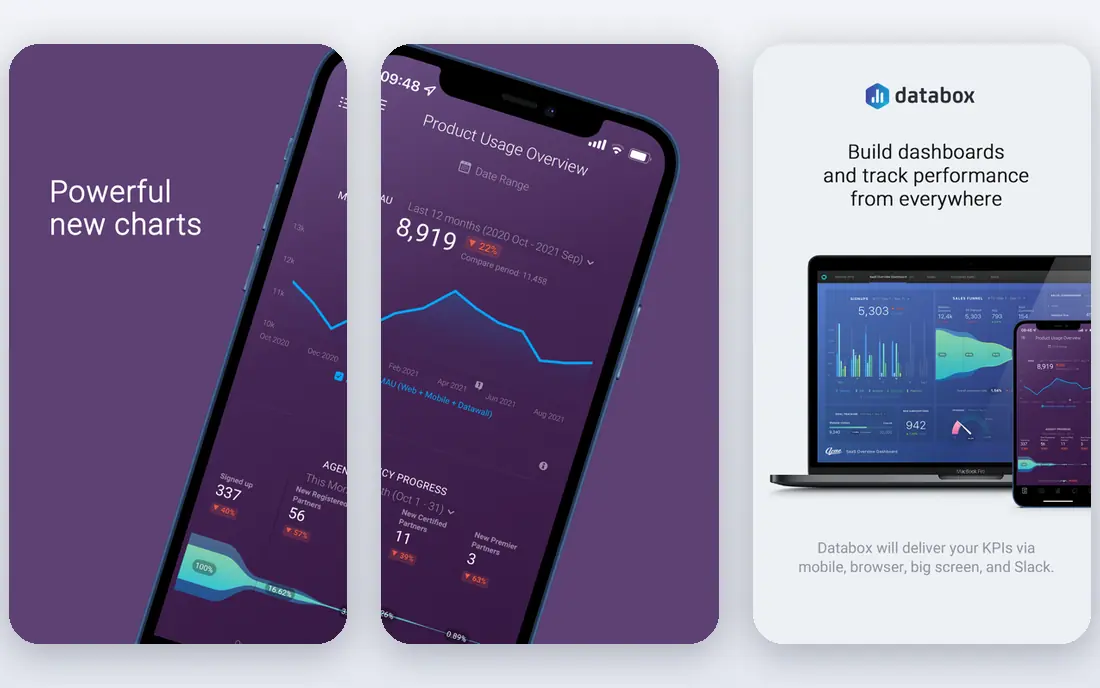
Databox suits teams that want dashboards tied to targets, not just charts. Users can set goals for leads, spend, traffic or revenue, then get alerts when performance moves off track. That structure helps managers spot problems between monthly report cycles. The integration library is broad, and boards can combine data from ads, analytics, CRM and social tools. A free plan lets small teams test the core idea before paying. Paid plans add more sources, clients and AI features, while white-labeling is an add-on on some tiers. Databox is less polished as a pure client PDF tool than some agency-first rivals. Its strength is ongoing monitoring and team visibility. For in-house teams and agencies that manage by goals, it is a practical choice.
- Broad integrations, goal tracking and alerts, useful AI summaries
- White-label costs extra on some plans, setup takes care for complex boards

Whatagraph is aimed at agencies and larger teams that treat the report itself as part of the client experience. Reports can blend data from many sources, apply custom calculations and present results in a clean, branded layout. That design control helps when clients compare channels or locations side by side. The platform also offers AI-assisted summaries and agents on higher tiers, which can speed up recurring reporting. Source coverage is broad, with premium connectors for systems such as HubSpot and Shopify on top plans. Teams should confirm which connectors sit on the plan they intend to buy. The main drawback is price, because entry plans are aimed at larger rosters rather than freelancers. Smaller agencies may find DashThis or AgencyAnalytics cheaper at low client counts. For larger agencies, Whatagraph justifies its cost with design and blending depth.
- Strong data blending, polished report design, useful AI report features
- Higher starting cost, annual billing on some plans
Supermetrics is not a reporting portal, and that distinction matters. It moves marketing data into Looker Studio, Google Sheets, Excel, BigQuery and other destinations, where teams build their own reports. That pipeline model suits analysts who want full control over calculations and layouts. The connector range is a key strength, covering ads, social, analytics and ecommerce platforms. Teams can schedule refreshes, combine sources and keep a single reporting model across clients. Pricing depends on sources and accounts, so model cost around actual data needs. Supermetrics is a poor fit for agencies that want a ready-made client login and branded portal. It also needs someone comfortable building and maintaining reports. For data-led teams with an existing BI workflow, it is often the most flexible option.
- Broad connector range, works inside familiar tools, good for custom analysis
- No client portal by itself, reporting design still needs Looker Studio or Sheets
DashThis is a good choice when speed matters more than deep customization. Teams can connect sources, pick a template and share a live dashboard in a short session. White-labeling is included on all plans, which is helpful for small agencies that want branded reports without paying extra. Pricing is based on dashboards and sources, with an entry plan covering three dashboards. That model suits freelancers and small agencies with a modest roster. AI insights and a managed connector option are available as add-ons on some plans. The limit appears when reports need heavy blending or warehouse-style modeling. DashThis handles standard cross-channel reporting well, but complex custom metrics may need another tool. For fast, readable client reports, it is hard to beat at its price.
- Quick setup, simple dashboard limits, white-label on all plans
- Less depth for complex blending, higher tiers needed for many dashboards
Klipfolio suits teams with an analyst who enjoys building metrics from scratch. Its formula and metric controls let users define calculations, combine sources and design dashboards that match internal definitions. That control is valuable when standard templates hide important nuance. The platform supports many integrations and can serve agencies or in-house teams. Dashboards can be shared by link, embedded or shown on screens, which helps operations teams keep numbers visible. PowerMetrics adds a metric catalog for teams that want governed definitions. The trade-off is skill, because casual users may find Klipfolio slower than template-first tools. White-labeling is included on higher plans or as an add-on below them. For analyst-led teams, that control is worth the learning curve.
- Formula-level control, broad integrations, flexible dashboard design
- Needs analyst skill, white-label costs extra below higher plans
Swydo is a budget-friendly agency reporting tool with a clear focus on paid media and core marketing channels. Its entry plan includes a set of sources, and white-labeling is included, which keeps branded reporting affordable for smaller agencies. Reports can be scheduled, shared and customized with client branding. The platform works best for PPC-led agencies that report on Google, Meta and Microsoft Ads plus analytics. Teams that need deep SEO suites, ecommerce platforms or niche connectors should check coverage first. Swydo trades breadth for simplicity and price. That trade is sensible for many small agencies, because most clients need the same core channels each month. Larger or full-service agencies may outgrow it. For cost-conscious reporting, Swydo is a strong value pick.
- Low entry cost, white-label included, focused paid media reporting
- Smaller integration library, less depth for SEO or ecommerce reporting
Looker Studio remains the best free starting point for teams centered on Google data. It connects directly to Google Ads, Analytics, Search Console and Sheets, and lets users build custom dashboards with filters, charts and calculated fields. For a single brand or a small agency, that is often enough. The limits appear with client management and non-Google sources. There is no built-in client portal with permissions per client, and many third-party connectors cost extra through tools such as Supermetrics. Design and maintenance also fall on the team, with no managed templates for every agency workflow. Looker Studio is ideal for in-house teams, freelancers and analysts who want control at no license cost. Agencies with many clients may prefer a portal-first tool. As a free foundation, it is still difficult to beat.
- Free core product, strong Google data connections, flexible design
- No built-in client portal, some connectors need paid third-party tools
How we picked these
We selected tools that are currently available and built for recurring marketing reporting, not one-off chart makers. We weighed integration coverage, client sharing, goal and alert features, and pricing transparency. Where vendor pricing was not published clearly, we used See website rather than an estimate.
What to check before you buy
Model cost at your real client count
Per-client, per-dashboard and per-source pricing behave very differently as you grow. Run the same roster through each shortlisted tool. A cheap entry plan can become the most expensive option at 20 clients.
Check the connectors you actually use
List every ad, analytics, SEO, social and CRM source for every client. Confirm each one is included on the plan you intend to buy, not just on the vendor homepage. Premium connectors and add-ons are a common surprise.
Test a full report cycle
Build one report from live data, schedule it, share it and revise it. Check how long refreshes take and how clients view results on mobile. A tool that looks good in a demo can still be slow in weekly use.
Decide who owns the data model
Template-first tools save time, while pipeline and formula tools give control. Pick based on team skill and reporting standards. If no one owns definitions, reports will drift even on the best platform.
FAQ
What is marketing reporting software?
Marketing reporting software pulls data from ads, analytics, social and CRM tools into dashboards and scheduled reports. It replaces manual exports with live or regularly refreshed views. Agencies use it for client reporting, while in-house teams use it for performance reviews and budgeting.
How much does marketing reporting software cost?
Costs range from free for Looker Studio to hundreds per month for larger agency platforms. Per-client tools charge as rosters grow, while dashboard tools charge by dashboard and source limits. Always model cost at your expected client count, not just today.
Is Supermetrics a reporting tool on its own?
Supermetrics is a data pipeline that feeds tools such as Looker Studio, Sheets and BigQuery. It does not provide a branded client portal by itself. Teams use it when they want custom reports in a tool they already know.
Do clients need a login to see reports?
It depends on the tool. Agency portals usually offer client logins, while other tools share live links or scheduled PDFs. Check permission controls if clients should only see their own data. Link sharing is convenient but weaker for privacy.
How often should marketing reports refresh?
Daily refresh is enough for most monthly and weekly reporting, while paid media teams may want intraday updates during active campaigns. Check refresh limits on your plan, because frequent refreshes can cost more. Match refresh speed to decisions, not to habit.
Can these tools replace a data warehouse?
They can reduce warehouse needs for standard reporting, but they do not replace a warehouse for complex modeling and long-term analysis. Teams with heavy blending, custom attribution or large histories often combine a reporting tool with BigQuery or a similar warehouse.
Sources
https://agencyanalytics.com https://www.databox.com https://whatagraph.com https://supermetrics.com https://dashthis.com https://www.klipfolio.com https://www.swydo.com https://lookerstudio.google.com